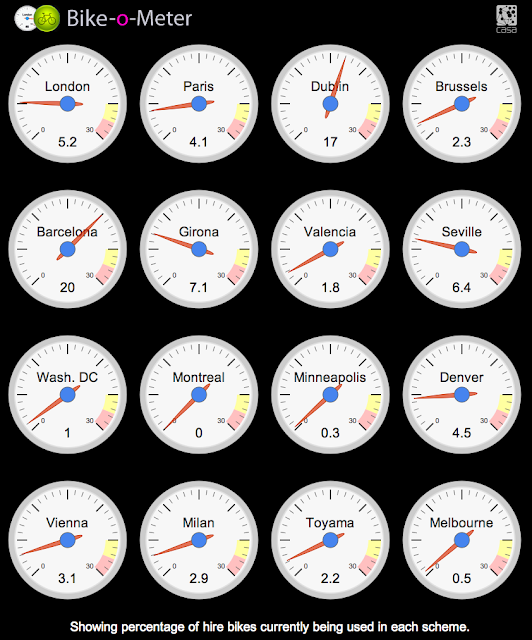
Well, Lucas, Copenhagen is missing too. I think maybe it's because these cities do not make the data available in real-time in a usable format.
Personally I think this says more about the information society, where all kinds of data is instantly accessible - including updated statistics about the usage in a bike-share system. Also that we wonder when some data is /not/ instantly accessible.
I thought these dials were supposed to somehow show the overall share in city commuting taken up by bike traffic. Now I see this shows the numbers (percentage of the total fleet?) of bikeshare programme bikes in use at a given time...
9 comments:
Woot! Go Denver!
Is it night-time in Melbourne?!
Why is FSD only 30%?
Sadly enough it probably wasnt and melbourne is supposed to be one of the more bike friendly parts of oz.
It is always night-time in Melbourne.
I guess Rio de Janeiro and Bogotá are missing there in this chart...
what a colonial way of thinking, ain`t it?!
Well, Lucas, Copenhagen is missing too.
I think maybe it's because these cities do not make the data available in real-time in a usable format.
Personally I think this says more about the information society, where all kinds of data is instantly accessible - including updated statistics about the usage in a bike-share system. Also that we wonder when some data is /not/ instantly accessible.
Sadly a number of the dials have been dropped due to action by the cycle scheme owners - see here:
http://www.digitalurban.org/2010/10/bike-o-meter-now-without.html
OH, NOW I understand...
I thought these dials were supposed to somehow show the overall share in city commuting taken up by bike traffic. Now I see this shows the numbers (percentage of the total fleet?) of bikeshare programme bikes in use at a given time...
Post a Comment