
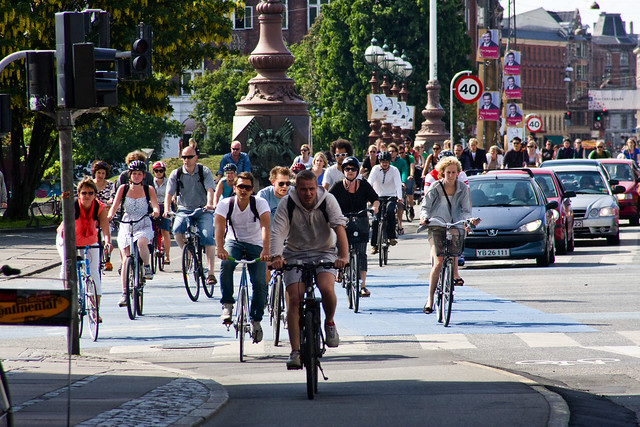
One thing we’ve being going on about here at Copenhagenize for six years is the importance of promoting cycling positively to the great untapped well of potential cyclists. The 99%, if you will.
Two years ago, Copenhagenize informed you about a research project that was funded by the national bicycle fund entitled Effective Bicycle Promotion - Development of methodology to determine the effect on messages regarding marketing of bicycle traffic. We had teamed up with Thomas Krag Mobility Advice to investigate how promoting cycling with positive imagery was more beneficial than using images involving fear or perceived fear.
Two years on, the results of the study are in. Have a read. And now, more than ever before, endeavour to sell urban cycling to the 99% with positive messaging.
Bicycle Marketing Messages: What Matters.
The report, collated by Sidsel Birk Hjuler and Thomas Krag, reveals some of the most important ingredients for the creation of successful cycling marketing campaigns.
Whilst the choice to ride a bicycle is primarily influenced by our knowledge of the physical space around us (distance, infrastructure, weather), we are heavily influenced by our emotional responses to media and marketing. Our research allowed us to unpack some of the ways in which consumers responded to cycle-focused marketing, and revealed a number of important results. For example, we discovered that an image of a cyclist wearing a helmet had a negative marketing effect on cycling, yet has a stronger positive marketing effect on cars than a typical car advertisement. Furthermore, when safety messages were included in the marketing campaigns, they were considerably more effective when the advert focused on the cyclist as an individual, as opposed to discussing the overall risk of cycling. Take a closer look at what we found:
Background and methodology
Many campaigns for behaviour changes, including increased cycling, have been introduced, and later evaluated (Prochaska et al, 2008; P. Hyllenius et al, 2009; Merseyside LTP Support Unit, 2010). We have wondered however, to what extent such campaigns should include messages related to bicycle safety, and whether these messages may have an adverse effect on cycling (see for example, Utility Cycling, 2013).
Whilst it may seem logical to carry out a variety of campaigns with a range of messages, and evaluating the effectiveness of campaigns afterwards, this method would be too time-consuming, and too-costly to implement. Other issues such as media publicity around a serious cycling accident, or an intensive car marketing campaign may attract public attention and influence the campaign’s outcome in an unpredictable way.
To conduct our research project, an alternative survey technique was used in order to analyze the respondents’ opinions. Respondents were presented with pictures without text, in order for us to report opinions using VAS scales (Visual Analogue Scales) with different statements given at end points, as suggested in the literature (for example, Wewers et al., 1990). Opinion scores and average opinion scores all fell in the interval 0 to 1 (0% to 100%), with 0 corresponding to the left VAS-scale end point and 1 corresponding to the right end point. In all cases, opinions related to the four modes of transportation - bicycle, car, bus and train - were included.
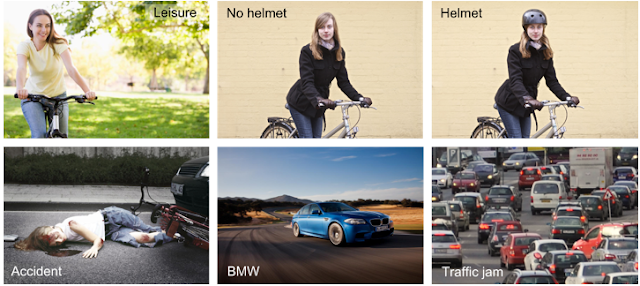
These six pictures as well as a neutral (blank) picture were used in the survey.
For our study there were 6 pictures used, all representing typic messages, as well as a blank picture (Neutral) included for reference purposes. The six pictures (Leisure, No helmet, Helmet, Accident, BMW, and Traffic Jam) are shown in the image above. Each of the respondents saw only one of the pictures, which appeared on the top and bottom of every page of the survey. These images were not explicitly explained, but were simply integrated into the layout of the page. A total of 3,500 responses, 500 per picture, were received and analyzed. Respondents were residents of Danish urban areas, and the survey was delivered by Epinion (Denmark).
Results
Unsurprisingly, we found that the pictures had an influence on the average opinion scores, and that the picture-induced differences were statistically significant (P-value of the null hypothesis was typically less than .02 for the highest and the lowest average opinion scores).
Experience
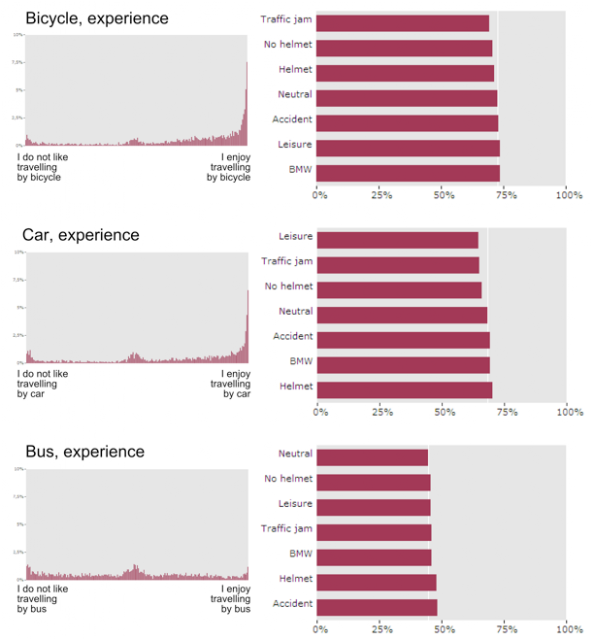
"Fingerprint" (distribution) of opinion scores on experiences for bicycles, cars and buses and average opinion scores versus picture for the same transportation modes. The fingerprint shows the share of respondents who have indicated a specific opinion score. A top at the right hand side of the fingerprint reflects that many respondents agree to the statement on the right end point of the VAS scale.
A central opinion when it comes to marketing is that the (expected) experience of the various modes of transport. End points on the VAS scales were ‘I do not like traveling by...’ and ‘I enjoy traveling by...’. The experience opinions, thus, are related to enjoyment. Bicycles and cars proved to be surprisingly similar in this context, with many high opinion scores, with cycling having the highest average opinion score of all transportation modes.
For cycling, the picture of the BMW (quite surprisingly) and the leisure picture (less surprisingly), gave the highest average opinion scores. The BMW-picture also had a positive impact on car experience, while - for all other modes than the bicycle - both the accident picture and the picture of a cyclist wearing a helmet gave the highest average opinion scores. This indicates that typical safety messages (e.g. ‘always remember to use a helmet’; ‘Cycling is dangerous’) have an adverse effect on bicycle marketing.
Notably, the average opinion score for travelling by car was higher after seeing the helmet picture than after seeing the BMW picture.
Risk Perception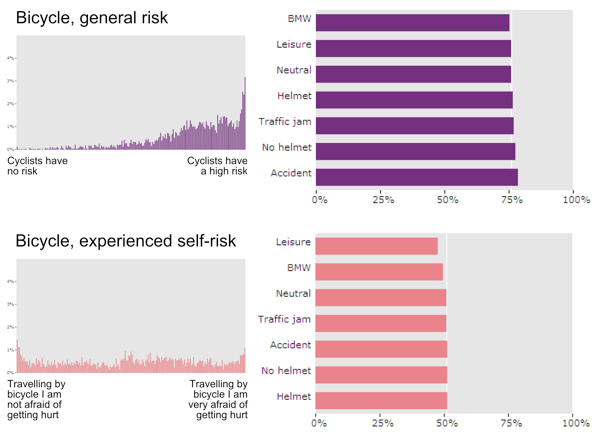
"Fingerprint” (distribution) of opinion scores and average opinion scores versus pictures for general risk and experienced self-risk for cyclists.
Although the general risk of cycling (‘Cyclists have no risk’/‘Cyclists have a high risk’) has a high average opinion score, the respondents’ experienced self-risk (‘When travelling by bicycle I am not getting hurt’/‘travelling by bicycle I am very afraid of getting hurt’) has a lower average opinion score and a totally different distribution (‘fingerprint’) of the scores.
As far as the general risk of cycling is concerned, the accident picture increases the average opinion score the most, while the BMW and the leisure picture lowers the score.
The pictures’ influence on the self-risk is about the same, except that most pictures here give a lower score than the neutral picture.
If one’s goal is to address safety issues while still wishing to promote cycling, these results indicate a good reason for focusing on the cyclist as an individual and leaving out general references to the risks of cycling.
Images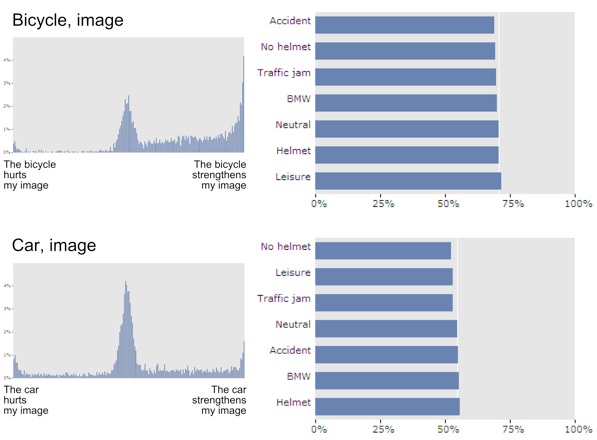
“Fingerprint” (distribution) of opinion scores and average opinion scores versus pictures for the image of bicycle and car.
Respondents were also asked about their opinion on the appearance of users of the various modes (whether the users looked good or not), as well as whether a given mode strengthened or hurt their own image. These questions are difficult, as many Danes find image to have no relevance, and several opinion scores fell in the middle of the VAS-scales. Nevertheless, the overall outcome was clear: Cyclists are found to look better than users of other modes, and the bicycle is also the mode which strengthens the respondents’ own image the most.
In contrast to what was found for experience, the helmet picture was found to be favorable to the average opinion score of appearance as well as the image of cyclists, compared to the no-helmet picture. The same tendency was found for car users. The BMW picture, on the other hand, reduced the average opinion score for cyclists’ appearance and increased it for car users’ appearance.
Values and bicycle helmets
Some final questions in the survey – with no possibility to go back and correct responses to previous questions – were asked on the values - health, comfort, well-being, freedom, control, rapidity/speed and quality of life - of the picture shown. The accident picture received very low average opinion scores, while the helmet picture attracted higher opinion scores than the no helmet picture on all values. This reflects a high public acceptance of bicycle helmets in Denmark. Wearing a helmet is voluntary, but wearing rates around 25% have been reported (Rådet for Sikker Trafik, 2011). (Ed: Copenhagenize Design Company's own research, however, indicates that the number is 17%, based on an all-day observation of 16,631 cyclists, and not just a count in the rush hour)
When indirectly asked however, other tendencies are revealed. In the appearance and image opinions mentioned above, the net effect is close to zero, as opinions on car users are shifted roughly the same from helmet/no helmet pictures as the opinions on cyclists.
The opinions on experience show a clear negative net-effect on cycling from the helmet versus the no helmet picture. So even though respondents declare themselves very positive towards helmets, a picture of a cyclist wearing a helmet makes them express themselves more in favor of other modes.
Conclusions
In spite of an apparently - and recent - high public acceptance of bicycle helmets in Denmark (due to shock-horror emotional propaganda), picturing helmets has an adverse effect on bicycle marketing. The same is true for a picture of a bicycle accident. From a bicycle marketing perspective (encouraging more people to use bicycles) such messages should be avoided. If safety issues need to be addressed, focus on the cycling individual is preferable for general statements on the risk of cycling.
Want to read more?
More information on the project and our results can be found on www.thomaskrag.com.
Picture credits
Leisure: iStockphoto, file #9116292, order no 20044837. No helmet and Helmet: Copenhagenize Consulting. Accident: ZNS – Hannelore Kohl Stiftung, Germany. BMW: BMW, Denmark. Traffic jam: Sidsel Birk Hjuler.
References
P. Hyllenius et al. (2009). MaxSumo – Guidance on how to plan, monitor and evaluate mobility Projects. URL: http://www.epomm.eu/docs/1057/MaxSumo_english.pdf (accessed on 23.06.2013)
Merseyside LTP Support Unit. Merseyside Cycle and Short Trip Evidence Study. Final report. 2010. URL: http://www.letstravelwise.org/files/570773362_Annexe%2008%20-%20Cycle%20&%20Short%20Trips%20Study.pdf (accessed on 23.06.2013)
Prochaska, James, et al. (2008). The Transtheoretical Model and Stages of Change in Health Behavior and Health Education – Theory, Research and Practice. Edited by Karen Glanz, Barbara K. Rimer and K. Viswanath. Jossey-Bass.
Rådet for Sikker Trafik, 2011. Markant stigning i brugen af cykelhjelme. Website. URL: http://www.sikkertrafik.dk/Aktuelt/Presse/Pressemeddelelser/Markant-stigning-i-brug-af-cykelhjelme.aspx (accessed on 23.06.2013)
Utility Cycling (Wikipedia). 2013. URL: https://en.wikipedia.org/wiki/Utility_cycling (accessed on 23.06.2013).
Wewers ME, Lowe NK. A critical review of visual analogue scales in the measurement of clinical phenomena. Res Nurs Health 1990; 13(4):227-236.
The Authors
Sidsel Birk Hjuler is Master of Arts in Urban Culture and Aesthetics. Besides this project she has worked for Copenhagenize Consulting, for BirkPlusPabst and is currently working for the Municipality of Elsinore, Denmark.
Thomas Krag is Master of Science, is previous managing director of Dansk Cyklist Forbund and currently director of Thomas Krag Mobility Advice.