 We like data at Copenhagenize Design Company. It’s a major part of our work, not least in our Desire Line Analyses of cyclist behaviour that we have done in Copenhagen and Amsterdam, and planning to do on a global scale. We film an intersection for 10-12 hours and spending a couple hundred hours analysing the behaviour, doing counts of everything we can and producing solutions for modernising intersections to priortise cycling and pedestrians. In association with the current Desire Line Analysis we are working on, on Søtorvet intersection in Copenhagen, we have added some data sets. Including performing a bike helmet count.
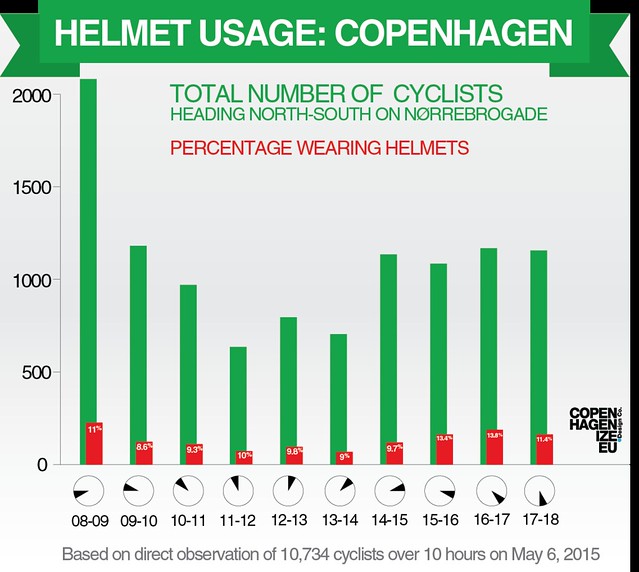
The reason is simple. There is no reliable data. The numbers we have seen are from the Danish Road Safety Council - Rådet for Sikker Trafik - and we are sceptical about them.
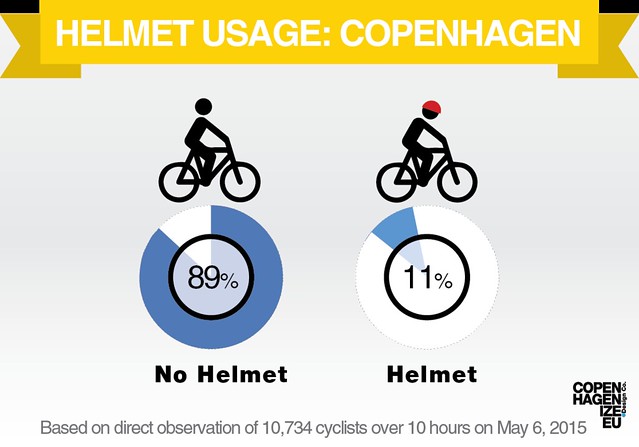
They claim that the helmet wearing rate is 26%. Their random counts during rush hour and some telephone surveys do not, however, provide reliable data. Especially considering that this car-centric NGO is desperate to brand cycling as dangerous and they do everything they can to prove that their helmet campaigns have been successful. When you work with an idealogy, you often skim over reliable data in order to get the result you want. What we did was simple. We looked at our 10 hours of footage from the intersection - the busiest in Denmark for cyclists. We studied all the cyclists on one specific Desire Line, heading into the city centre, between 8 AM and 6 PM on May 6, 2015. The best way to determine a number is to see what the regular citizens are doing. They, and they alone, are the main indicator of safety and perception of safety. 10,734 cyclists in all, throughout the day. That is good, solid number to base some data on. Not just the morning commuters, but all the different types of people using the bicycle infrastructure throughout a typical day in Copenhagen. As you can see, the data provides us with a very different number than the Danish Road Safety Council's exaggerated number. 11% of cyclists were wearing helmets. Safe to say that the vast majority feel safe and they have rejected the emotional propaganda from the Danish Road Safety Council. Using instead, their own rationality.