
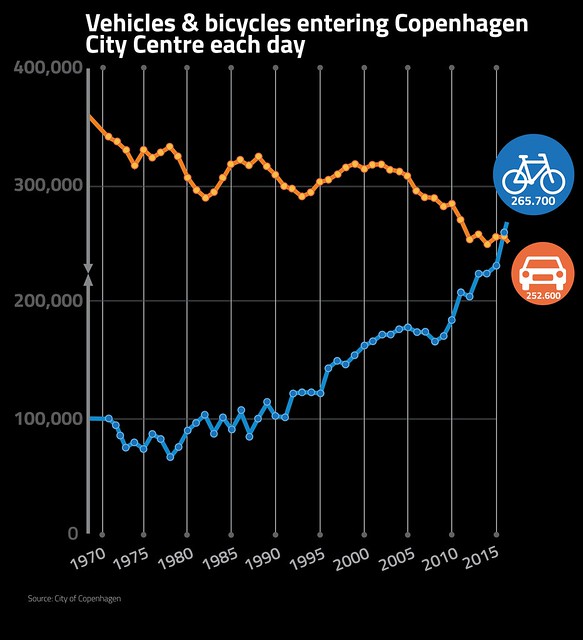
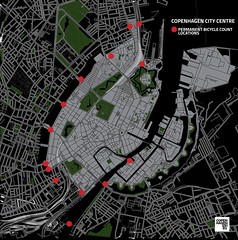
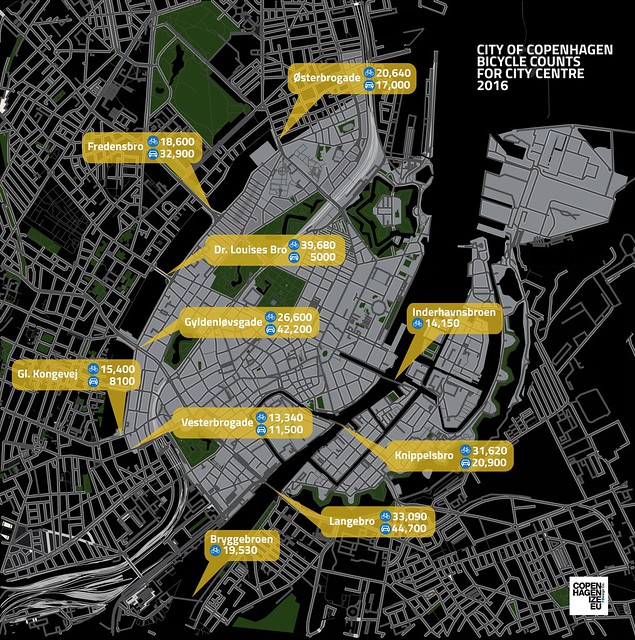
 The news out of Copenhagen this week is good. Apart from an arsenal of over 20 permanent sensors dedicated to counting bicycle traffic, the City of Copenhagen also performs comprehensive bi-annual counts and the latest numbers, from September, are exceptional. For the first time since the City starting counting traffic entering the city centre, there are more bikes than cars. Indeed, since last year, 35,080 more bikes were counted, bringing the total up to 265,700, as you can see on the graph, above.
It is a clear indication that continuous municipal policy and investment in Best Practice infrastructure pays off. The City has gone above and beyond over the past ten years. Investing 1 billion DKK (€134 million) extra in infrastructure, facilities and, not least, bicycle bridges to prioritise cycling as transport.
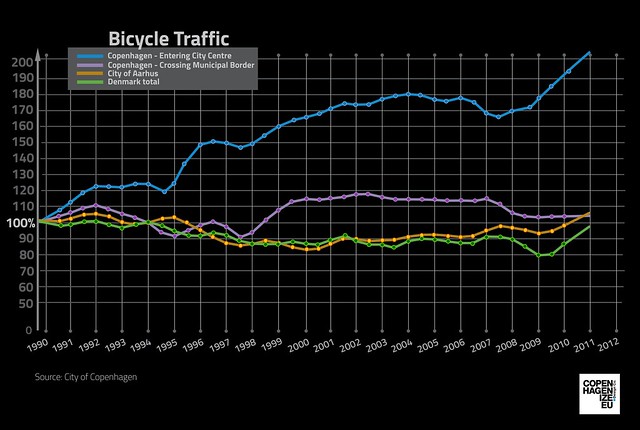
It's no secret that cycling for transport is down in Denmark on a whole. Widespread prosperity (the financial crisis didn't really register here) and the fact that buying a car is cheaper now than during the oil crises in the 1970s means that people are buying them, despite the (rather irrelevant) 180% tax on cars. They are, however, buying then outside the larger cities and often buying a second car for the family. Car ownership in Copenhagen is still low at 25%. Even though a resident's parking permit can be bought for a ridiculous €100 a year, it is clear that Copenhageners prefer bikes and public transport. Especially the former, as you can see on that spectacular blue line, above, shooting through the top of the chart.
It is also very relevant to mention that the city is still rather difficult to drive around, what with the construction of 17 new metro stations. We have written about The Greatest Urban Experiment Right Now and the City still has to prepare for the future. The modal share for bikes has slipped already. We need to ensure that we maintain the rising numbers.